Are you ready to revolutionize your trading and Investment strategy? Let’s talk about a game-changing tool: the Periods When to Make Money chart, a trader’s secret weapon since 1875. This isn’t just history – it’s your golden ticket to understanding market cycles.
You have access to a proven guide that has helped investors identify the best times to buy and sell for nearly 150 years. Originating from George Tritch, this chart is a treasure trove of insights, making it indispensable for today’s intelligent investors.
Why is this crucial for you? It’s simple. The chart sheds light on lucrative “buy” and “sell” periods, turning market complexities into opportunities. Think of it as your financial compass, guiding you to smarter, more profitable decisions.
History of Tritch’s Chart/ Benner Cycle
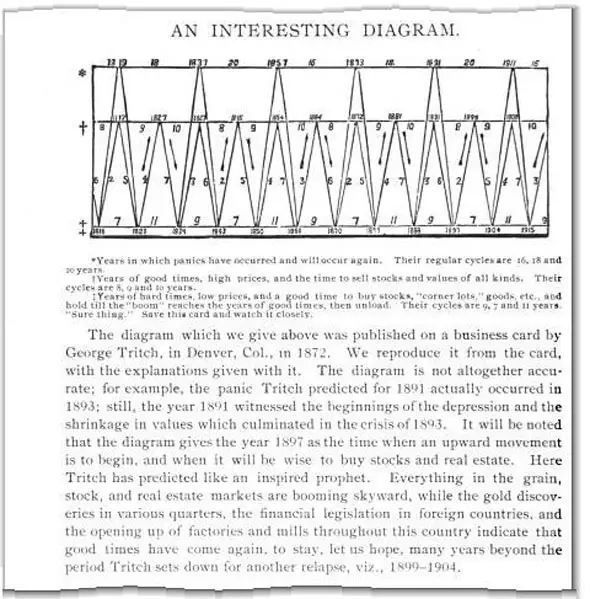
Exploring the origins of the “Periods When to Make Money” Chart, also known as the Benner Cycle, historical records present a complex narrative. The first diagram traced back to the late 1800s, cites dual origins: George Tritch in 1872 and Samuel Benner in 1875. Tritch’s association with the chart is evidenced by copyright dates of 1872, 1883, and 1897 linked to his hardware business. Conversely, Benner’s 1875 book “Benner’s Prophecies of Future Ups and Downs in Prices” suggests a later involvement, though Tritch seems to have developed the diagram earlier.
The debate over who truly originated the Cycles Chart continues. While Benner’s publication gained more prominence, Tritch’s earlier copyrights and business materials challenged this narrative. Benner’s emphasis on solar cycles affecting agricultural prices may have inadvertently overshadowed Tritch’s earlier contributions.
Additional sources, including bloggers and historians, support Tritch’s creation of the chart in 1872, a fact Benner seemingly overlooked in his 1875 work.
Regarding the chart’s absence from the 2008-2012 financial crisis, it’s important to recognize its unique methodology. It delineates periods ideal for buying or selling, with 2007 marked as a prime selling time, aligning with the crisis’s inception, and 2012 as a prime buying opportunity.
Presently, in 2023, we are in a phase deemed favourable for purchasing, with 2026 predicted as an opportune selling time. The cycle anticipates a fluctuating economic period around 2032, reminiscent of the 2008-2012 scenario.
Explained the “Periods When to Make Money” Chart
Tritch’s insightful approach to market dynamics is encapsulated in a meticulously structured three-phase model, each phase representing a distinct stage in the market cycle. This model is a crucial tool for investors seeking to navigate the complexities of market trends.
Category A: The Onset of Bear Markets
This category marks a pivotal shift in market dynamics, signalling the beginning of a downward trend. It’s characterized by panic selling and significant trend reversals. This phase is critical for investors to recognize as it often heralds the start of a bearish market, necessitating a cautious investment approach.
Category B: The Climax of Market Highs
In stark contrast to Category A, this phase epitomizes the peak of the market. It’s the ideal time for investors to capitalize on high asset prices, making it the most opportune moment for selling. This phase represents the height of market prosperity and is often characterized by investor optimism and high trading volumes.
Category C: The Buying Window
This final category indicates a period where the market is at its lowest, offering prime opportunities for purchasing assets. Signifying the onset of a bullish trend, this phase is particularly important for investors looking to enter the market or expand their portfolios at favourable prices.
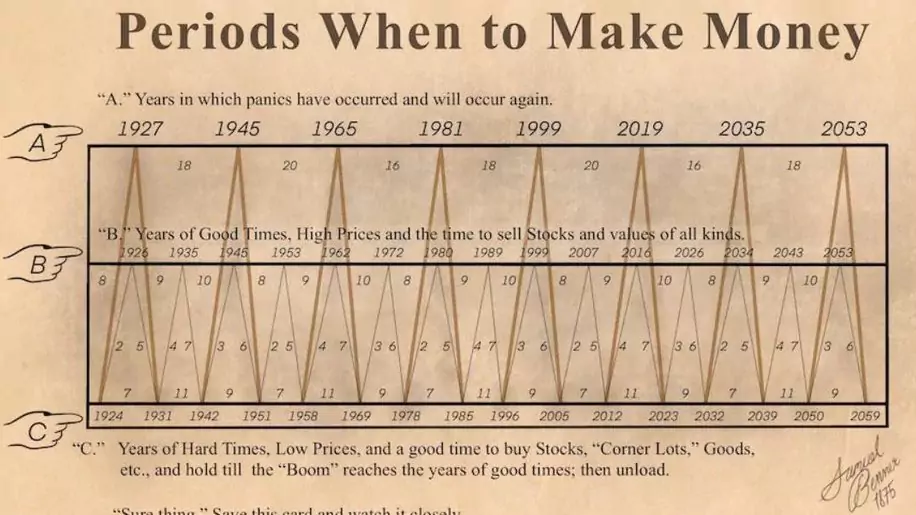
The cyclical pattern in Tritch’s model/ Benner Cycle is both distinct and variable:
- The peak of the cycle (Category A) recurs approximately every 16, 18, or 20 years.
- The halfway mark (Category B) is seen in cycles spanning 8, 9, or 10 years.
- The cycle’s bottom (Category C) varies more, occurring in shorter spans of 3–6 years, 2–5 years, or 4–7 years.
Tritch’s model not only outlines these phases but also emphasizes the predictability of market cycles. By understanding these recurring patterns, investors can strategize their investment decisions, aligning them with market rhythms to optimize returns and minimize risks. The model serves as a vital tool for financial planning, offering insights into the timing of market entries and exits
Is the Benner Cycle/ Tritch’s Market Cycle Reliable?
One of the most striking aspects of Benner Cycle/Tritch’s Chart is its ability to accurately predict significant market events. Let’s examine some historical events that this chart successfully predicted:
The Great Depression (1929 – 1941)
The Great Depression is known as one of the most significant economic downturns in history, and Tritch’s chart accurately predicted it. The stock market crash of 1929 and its eventual recovery during World War II in 1941 aligned with Tritch’s chart predictions. The chart indicated that 1926 and earlier were prosperous times, whereas 1927 was a period of panic. It even predicted that the hard times would culminate in 1942.
The Oil Crisis (1973)
The 1973 oil crisis, sparked by an oil embargo, led to soaring oil prices, which negatively impacted the stock market. Tritch’s chart predicted promising economic times in 1972 and challenging times in 1978.
Black Monday (1987)
On October 19, 1987, the stock market crashed unexpectedly, which came to be known as Black Monday. While the exact cause remains unknown, Tritch’s chart predicted a crash in 1985, only a few years before.
The Dot-Com Bubble (1995 – 2002)
The chart created by Tritch corresponds with the dot-com bubble, which was characterized by a rapid increase and sudden drop in stock prices. The chart indicates that 1999 was a time of panic, which was linked to the fear of the Y2K bug and the surge of investments in internet-based businesses. However, it was slightly inaccurate in predicting the lowest point, as it occurred in 2002/2003.
The Financial Crisis (2007 – 2008)
The global financial crisis was triggered by the collapse of subprime mortgages in 2007, which extended into 2008. Tritch’s chart is considered responsible for this event. The chart predicted prosperity in 2007, matching the heightened levels of real estate investment during the mid-2000s.
However, it was slightly off in predicting 2012 as the crash year. Despite this, the chart remarkably anticipated the economic boom that preceded the crash.
Tritch’s chart seemed to have a good understanding of the market movements. While it is not perfect, its historical performance is impressive. It has the potential to provide a broader cyclical wisdom that could benefit traders and investors.
Comparing the Benner Cycle/ Tritch’s Market Cycle to Other Market Prediction Cycles
The Benner Cycle/Tritch’s Market Cycle is not the only approach to predicting market movements. Various other market prediction cycles offer different perspectives.
- Gann Cycle: W.D. Gann theorizes that financial markets follow predictable cycles related to natural phenomena. Tritch’s Chart focuses on specific price cycles.
- Elliott Wave Cycle: This theory, developed by Ralph Nelson Elliott, proposes that financial markets follow predictable wave patterns. Tritch’s chart diverges by focusing on economic phases.
- Fibonacci Cycle: Emerging from the Fibonacci sequence, this cycle is associated with mathematical concepts introduced by Leonardo Fibonacci. It departs from the Benner Cycle’s commodity-specific orientation.
Crafting Trading Strategies with the Benner Cycle/ Tritch’s Chart
One of the most compelling facets of Tritch’s chart is its potential application in crafting trading strategies. I have unearthed several strategies that can be employed to make well-informed decisions, founded on the insights gleaned from the cycle:
Buying in Hard Times
When Tritch’s chart indicates tough economic conditions, it often signals an opportune moment to acquire assets with the anticipation that these investments will appreciate as the economy progresses towards more favourable times.
Selling in Good Times
During the “good times” phase, prices usually rise to significant heights. Investors are encouraged to sell their assets to maximize their profits before market conditions shift.
Holding in Panic Years
The volatile “panic” years are not ideal for making prudent investment decisions. Investors are advised to hold their assets and wait for more stable conditions.
A Note of Prudence
Wrap Up
That’s the scoop on the Periods When to Make Money chart! Originating in the late 1800s, it’s a fascinating blend of George Tritch’s foresight and Samuel Benner’s publicity. This chart isn’t just a piece of history; it’s a testament to early financial prediction methods.
It serves as a reminder of how past insights can still resonate in today’s financial landscape, blending historical curiosity with a touch of mystery. Whether for investment strategies or historical intrigue, this chart remains a unique glimpse into the financial thinking of the 19th century.